Researching Japan, Hong Kong, Korea and China Stocks with AI
Explainer

The short answer: most AI research tools are built around US stocks, and they stumble on Asian markets in predictable ways: local ticker codes, fiscal years that end in March or May, reports released after the local close, and research written in Japanese, Chinese or Korean. Web search makes it worse, because English-language content on these markets is thinner, older and more contradictory. Connecting an assistant like Claude or ChatGPT to a data source that covers these markets natively fixes most of that. Free sources such as yfinance (which uses exchange suffixes for Asian tickers) and local filing portals handle prices and filings. Distilla adds explained price moves, company events and summaries of sell-side views and podcasts for the most-followed companies in the US, Japan, Hong Kong, Korea and China A-shares.
Why a data layer matters most outside the US
An agent that researches stocks from web search alone can return content that is biased, outdated, incomplete or wrong. Search results are ranked on criteria other than relevance, search is not built around timestamps, and many articles are vague about their dates, so an agent asked why a Japanese stock moved on a given day can attach the wrong event to it. It cannot work bottom-up across a market, it misses commentary that sits in podcasts and research summaries, and it can answer the same question differently on different runs. The risk is larger for Japanese, Hong Kong, Korean and Chinese companies, where fewer English sources exist and local tickers and fiscal years invite mistakes. For an investor putting money into these markets on the strength of an agent’s analysis, a governed data source matters.
You don’t need every market, just the investable ones
Most coverage maps are wider than most investors need. By our estimate, roughly 2,000 to 3,000 listed companies in the main developed and Asian markets open to international investors (the US, Japan, Korea, Hong Kong and Taiwan) have a market capitalization above $2B and daily liquidity above $20M. That is roughly the set that Wall Street brokers cover, so research, estimates and call transcripts exist for it and thin out below it. Three practical points follow:
• Focus on the liquid core. A server that covers the most-followed companies deeply is worth more than one that lists every ticker shallowly.
• For small caps, read the filings. Data vendors and web content are thin below the broker-covered set, so the primary documents are usually the best source.
• Skip markets you cannot invest in. If you have no licence to invest in China or India, there is no reason to pay for coverage of them. If you do invest in China A-shares, check that your data source covers them.
Enterprise data vendors cover more markets, but they are priced for funds. Among self-serve vendors, some, such as Financial Datasets, cover only US stocks. Distilla is built for the liquid core of Japan, Hong Kong, Korea and China A-shares alongside the US, at prices individual investors and analysts can pay. It is not complete: at about 1,200 companies today across all its markets, it covers a fraction of that liquid core and is expanding, so check that your names are in before relying on it.
Why US-first tools stumble on Asian stocks
Tickers. Asian stocks trade under numeric codes with exchange suffixes. 4716.T is Oracle Corporation Japan, a separate listed company from Oracle in the US. 0700.HK is Tencent, 005930.KS is Samsung Electronics, and 300502.SZ is Eoptolink on the Shenzhen exchange. A model working from memory can easily mix a local listing up with a US parent or an ADR, or simply not recognize the code.
Fiscal years. Oracle Corporation Japan’s year ends on 31 May. Toyota’s ends on 31 March. Tencent and Samsung use the calendar year. So “FY2027” points to different twelve-month periods depending on the company, and different sources label the same period differently: one may call the year ending March 2028 “FY2027”, another “FY3/28”. Comparing companies without checking the end dates gives you misaligned numbers.
Timing. Many Hong Kong and Japanese companies report after the local market closes, so the price reaction lands the next trading day. A tool that matches price moves to report dates without allowing for that will attribute the move to the wrong day.
Coverage. Some popular financial data APIs are US only. Financial Datasets, for example, states in its documentation that “Non-US markets are not yet available” (read on 7 October 2026). Ask an assistant connected only to a source like that about a Hong Kong stock, and it has nothing to retrieve.
What Distilla covers for Japan and Hong Kong stock research with AI
Distilla is the fundamental research layer for AI agents: an MCP server and HTTP API that gives Claude, ChatGPT and your own agents explained price moves, earnings-call facts, summaries of sell-side views and podcasts, business drivers, events, peers, financial statements, consensus and valuation. Its core coverage is the most-followed companies in the US, Japan, Hong Kong, Korea and China A-shares.
Explained price moves and company profiles. Coverage is deepest in Japan and Hong Kong, where Distilla tracks hundreds of the most-followed companies. In Korea and the China A-share market, it covers the most-followed leaders, a smaller set. Every close-to-close move of 3% or more gets a written cause, using the same threshold in all five markets.
Summaries of sell-side views and podcasts. These reach further than the company profiles. In Distilla’s library, summaries are tagged to more than 1,000 Japanese tickers, more than 1,000 Hong Kong tickers, more than 2,400 China A-share tickers and more than 400 Korean tickers, drawing on global and Chinese brokers. For companies outside the core set, these summaries are the main coverage rather than a full company profile.
Local detail. Prices carry their currency, and fiscal periods come with their start and end dates, so an assistant can line up companies with different year-ends correctly.
Example: one trading session across four markets
On 18 September 2026, Distilla recorded 50 moves of 3% or more across the four Asian markets: 21 in Hong Kong, 20 in Japan (16 up, 4 down), 6 in China A-shares and 3 in Korea. We asked Claude, with Distilla connected, to count the moves in each market first, then explain them.
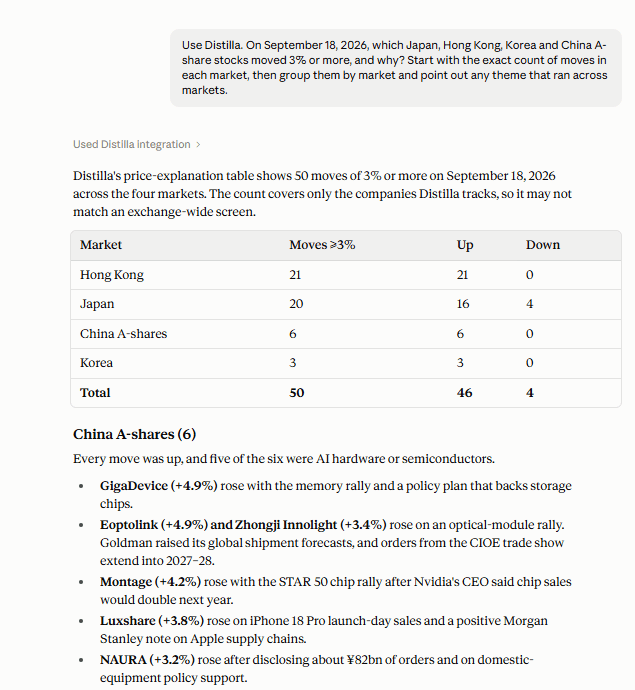
Claude with Distilla connected, counting the 18 September 2026 moves by market before explaining them, starting with China A-shares.
Asking for the count first is a small trick worth copying. It makes the assistant commit to the full list before it starts summarizing, so nothing quietly drops out.
In the A-share market, five of the six movers were AI hardware or semiconductor names. GigaDevice rose 4.9% with the memory rally, and the optical-module makers Eoptolink and Zhongji Innolight rose 4.9% and 3.4%. The one exception was Luxshare, up 3.8% on iPhone launch-day sales and a Morgan Stanley note on Apple’s supply chain.
In Japan, Kioxia rose 9.4% after Kioxia and SanDisk announced a Japan memory investment plan of more than $31 billion through 2032. Lasertec rose 8.7% and Advantest 6.0%, the latter on a J.P. Morgan top-pick call. Tokyo Electron rose 4.2% without a company-specific driver, which is what you would expect for a large chip-equipment stock on a sector day.
In Hong Kong, all 21 movers rose. SMIC and Hua Hong rose 4.4% and 4.8% in the global chip rally, and ASMPT rose 5.1% on a Morgan Stanley top-pick call. The largest moves, though, were company news: Vobile up 12.7% on an acquisition, Joinn Labs up 10.1% and Lenovo up 9.5% on an automotive computing partnership.

The Korea section of the same answer, and the theme that ran across all four markets.
In Korea, all three movers were memory or AI-hardware names. SK hynix rose 6.4% on BofA and Intel comments that memory shortages would tighten into 2027, and Samsung Electronics rose 3.4% after its own comments on next year’s supply gap.
Pulling it together, the answer identified one theme across all four markets: an AI and semiconductor rally that began in the US overnight, led by memory and optical names. By its count, about 21 of the 50 moves were directly chip-related.
Not everything fit the theme. Nidec rose 4.85% after the activist fund Oasis raised its stake. Kingsoft rose 4.3% after its chairman bought more shares. Santen fell 3.2% after China approved its myopia eye drop, an approval the market had expected. Several moves had no stated driver, and the answer said so instead of guessing. It also flagged that some explanations leaned on generic industry reports, and that one cited a broker note dated after the move.
That mix is the value of the exercise. In one session, you can see which moves were part of a regional theme, which were company news, and which were just flows.
Prompts to try
Each of these works in Claude or ChatGPT with Distilla connected.
• “Which Japan, Hong Kong, Korea and China A-share stocks moved 3% or more yesterday, and why? Group them by market and point out any theme that ran across markets.”
• “Which Japanese consumer companies are trading at the bottom of their own three-year NTM P/E range, and of those, which have improving news flow?”
• “Review the past earnings season for Hong Kong-listed tech stocks. Any common themes?”
• “Compare what global banks and Chinese brokers have said about Tencent over the past month.”
• “List Toyota’s and Samsung’s last four reported quarters with the period end date for each, then compare operating margins.”
Free sources for Asian markets
Distilla is not the only place to start, and for some jobs it is not the best one.
• Prices. Yahoo Finance data, through community-built yfinance MCP servers, uses the same exchange suffixes (.T, .HK, .KS, .SS, .SZ) and covers far more tickers than any research layer.
• Filings. Each market has an official portal: EDINET in Japan, HKEXnews in Hong Kong, DART in Korea, and CNINFO for China A-shares. For small caps and for any figure you will rely on, start there.
• Macro. FRED covers US series and some global ones for free.
Use a research layer when the question is about why something moved, what the narrative is, or what is happening across many companies at once.
Tips: exchange suffixes, currency and fiscal-year labels
Use the full ticker with its suffix. It removes most ambiguity.
Suffix | Market | Example |
.T | Tokyo Stock Exchange | 4716.T (Oracle Corporation Japan) |
.HK | Hong Kong Stock Exchange | 0700.HK (Tencent) |
.KS | Korea Exchange, KOSPI | 005930.KS (Samsung Electronics) |
.KQ | Korea Exchange, KOSDAQ | 196170.KQ (Alteogen) |
.SS | Shanghai Stock Exchange | 603986.SS (GigaDevice) |
.SZ | Shenzhen Stock Exchange | 300502.SZ (Eoptolink) |
Say which listing you mean. Alibaba trades as 9988.HK in Hong Kong and BABA in New York, in different currencies. Name the one you want.
Ask for the currency. Prices and financials are in local currency: yen, Hong Kong dollars, won or yuan. If you want US dollars, ask for the conversion and the rate used.
Ask for period end dates, not just fiscal-year labels. “FY2027” is ambiguous across companies. Asking for the period end date makes comparisons line up.
Allow for after-close reporting. When you look at how a stock reacted to results, check the next session as well as the report date.
FAQ
Can AI tools research Japanese and Hong Kong stocks?
Yes, if they are connected to data that covers those markets. On their own, AI assistants often confuse local tickers and fiscal years, and some financial data APIs cover US stocks only.
Which Asian markets does Distilla cover?
Japan, Hong Kong, Korea and China A-shares, plus the US. Coverage of explained price moves is deepest in Japan and Hong Kong; in Korea and China A-shares it covers the most-followed leaders. Summaries of sell-side views and podcasts are tagged to a wider set of Asian tickers. Company-level coverage is about 1,200 companies in total today and expanding.
Does Distilla cover small caps?
Distilla’s core coverage is the most-followed companies, a subset of the set that brokers cover. For small caps outside that set, the filings themselves are usually the best source.
Does Distilla include views from Chinese brokers?
Yes. Its library includes summaries of views from Chinese brokers alongside global banks. They are summaries, not the original reports.
What does the .T or .HK suffix mean?
It identifies the exchange: .T is Tokyo, .HK is Hong Kong, .KS and .KQ are Korea, and .SS and .SZ are Shanghai and Shenzhen.
How do I compare companies with different fiscal years?
Ask for the period start and end dates rather than the fiscal-year label, and compare periods that end at similar times.
How much does it cost?
There is a free plan, and paid plans run from $9.90/month to $249/month.
Is this investment advice?
No. Distilla is a research tool, not investment advice. The stocks in this guide are examples of how the data works, not recommendations.
About Distilla
Distilla is the fundamental research layer for AI agents: why stocks move, not just where. It brings institutional-grade research data to individual investors and small teams through an MCP server and HTTP API that gives Claude, ChatGPT and your own agents quantitative data, qualitative research and structured company knowledge in one queryable, read-only layer. The same data powers an enterprise product used by institutional investors.
• Quantitative: financial statements, analyst consensus, valuation history and company metrics, including AI-extracted segments and industry-specific KPIs.
• Qualitative: earnings-call and filing commentary, about 200K summaries of sell-side views and investor podcast episodes, and 7.3M+ qualitative knowledge cells (segments, guidance, KPIs and topic changes extracted from filings and calls).
• Company intelligence: company events (about 50,000 added weekly, 100+ event types), products, peers and sector relationships, and 438K+ explained price moves of 3% or more.
Company-level coverage is about 1,200 companies today, expanding across the US, Japan, Hong Kong, Korea and China A-shares; view and podcast summaries extend beyond that universe. Read-only MCP server at https://api.distilla.ai/mcp, with the same lookups over an HTTP API. Works with Claude, ChatGPT, Claude Code, Cursor, WorkBuddy and Doubao. Free plan, with paid plans from $9.90/month. Distilla is a research tool, not investment advice. Figures are as of 7 October 2026.