How to Build a Sony DCF with Scenarios Using Claude or Codex and Distilla
Explainer

The short answer: a good Sony model has to handle a conglomerate. Games, Music, Pictures, Entertainment Technology & Services and Imaging & Sensing Solutions have different drivers and different peers, so one consolidated growth rate hides the story. An AI agent connected to Distilla can gather dated inputs for each segment, strip out one-offs, build base, bull and bear cases, and run a reverse DCF to show what the share price already assumes, all from the same evidence base.
Why a DCF needs a data layer behind the agent
A DCF built by an agent from web search is only as good as the pages it happened to find. Segment figures, guidance, one-offs and consensus are scattered across filings, results slides, press releases and news. Search ranks pages on criteria other than relevance, is not built around timestamps, and many articles are vague about when they were written, so numbers get mixed across periods and definitions. Some of the best context sits in transcripts, research summaries and podcasts that search does not read thoroughly. And because sources conflict, an agent can build a different model each time you ask. If the model is going to inform a capital decision, that is not acceptable.
This workflow draws on several layers of data through one connector: financials (segment results, guidance, consensus, valuation), narrative (results commentary, and summaries of sell-side views and podcasts) and company knowledge (drivers, events and peers). Distilla extracts segment numbers and industry-specific KPIs from filings with AI, so the agent works from dated, sourced inputs. You can also use free sources for the basics, such as Sony’s own investor relations materials and yfinance for prices, and use Distilla for the segment detail, events and context that are hard to assemble by hand.
Sony earnings analysis with AI: why Sony is a hard test
Sony is a useful stress test because almost every shortcut in a quick DCF goes wrong here.
Five segments with different economics. In Sony’s guidance for the year ending March 2027, operating margins range from about 7% in Entertainment Technology & Services to about 20% in Imaging & Sensing Solutions. A single group margin averages away the differences that matter.
A yen-sensitive P&L. Foreign exchange added about ¥52bn to first-quarter operating income, and the full-year guidance assumes about ¥153 to the dollar for the rest of the year. A few yen either way moves the answer.
One-offs inside the guidance. The guidance includes about ¥80bn of US tariff refunds, booked mostly in Games. Leave them in and the base year is overstated.
A very large capex item. Sony and TSMC’s image sensor joint venture, as reported on 11 August 2026, involves a total investment of ¥747bn, of which Sony’s share is ¥465bn, with mass production planned for 2029.
Corporate activity and capital returns. Sony has made a non-binding proposal to take Tamron private, has a buyback facility of up to ¥500bn running to May 2027, and raised its dividend to ¥35 a share. It has also signed definitive agreements, on 31 March 2026 (per TCL Electronics’ announcement), to move its TV and home audio business into BRAVIA Inc., a joint venture 51% owned by TCL Electronics and 49% by Sony, which is expected to start operating in April 2027 at an enterprise value of about ¥102.8bn.
A model built only from the consolidated statements misses all of this.
The input map
Before building anything, list what the model needs and where each input comes from. This is the table we asked Claude to fill, with Sony’s values from Distilla.
What the DCF needs | Where it comes from in Distilla | Sony example (dated) |
Segment build | Segment financials, earnings summaries, management commentary | FY26 operating income guide of ¥1,720bn: Games ¥660bn, Music ¥420bn, Pictures ¥150bn, ET&S ¥150bn, I&SS ¥420bn; the segments total ¥1,800bn, and all other, corporate and eliminations take about ¥80bn off that (31 Jul 2026 revision) |
Quality of earnings | Earnings summaries, events | About ¥80bn of tariff refunds in the FY26 guide; FX added about ¥52bn to Q1 operating income (31 Jul 2026) |
Capex | Events, filings, news | Sony–TSMC sensor JV: ¥747bn total, Sony ¥465bn (reported 11 Aug 2026) |
Shareholder returns | Events | Buyback of up to ¥500bn, May 2026 to May 2027; dividend of ¥35 a share for FY26 |
Guidance and targets | Earnings summaries, filings | Full-year guide raised on 31 Jul 2026 from ¥1,600bn to ¥1,720bn |
Scenario shape | Sell-side and podcast summaries, drivers, price-move explanations | Bull and bear ranges for margins and the yen |
Consensus and comps | Consensus estimates, valuation multiples, peers | FY26 consensus operating income of ¥1,777bn from 23 estimates (2 Oct 2026) |
Here is part of Claude’s answer when we asked it to build this map.

Claude with Distilla connected: segment sales and operating income, with the latest quarter, last year’s actuals and the revised guidance.

The one-offs and FX table from the same answer, each item with its date and source.
Two things in the answer are worth noting. Every input carries a date and a source. And where Claude could not confirm something, it said so: it flagged that a reported ¥200bn price for Tamron came from a media report rather than either company, and that one JV cost figure could not be matched to the results slides.
Step by step: the prompts we used
You can run this in Claude, Claude Code or Codex. Connect Distilla first.
• Claude: add https://api.distilla.ai/mcp as a custom connector and sign in.
• Claude Code: run claude mcp add --transport http distilla https://api.distilla.ai/mcp, then /mcp to sign in.
• Codex: OpenAI’s documentation adds a remote MCP server with codex mcp add distilla --url https://api.distilla.ai/mcp and signs in with codex mcp login distilla. Distilla does not yet list Codex among its supported clients, so test the connection before you rely on it.
Then work in stages, checking each one before moving on.
1. Gather and date-stamp the inputs. “Use Distilla. Build the input map for a segment DCF of Sony (6758.T). For each business segment, give the latest segment sales and operating income and management’s guidance for the fiscal year ending March 2027. Also list one-offs such as tariff refunds and FX effects, capex plans including the image sensor joint venture, the buyback and dividend program, any acquisition proposals, and consensus operating income. Date-stamp every input and name its source.”
2. Build the base case, reconciled to guidance, and the bull and bear cases. “Now build base, bull and bear segment DCF cases in code. Reconcile the base case to guidance, strip out one-offs, and use segment-specific growth and margins.”
3. Add sensitivity and a reverse DCF. “Add a sensitivity table for WACC of 7% to 9% and terminal growth of 1% to 3%. Then run a reverse DCF: what operating income growth does the current share price imply? Show per-share values against the current price.”
4. Export. “Export the model to an Excel file, with a sourcing tab that lists every input, its value, date and source.”
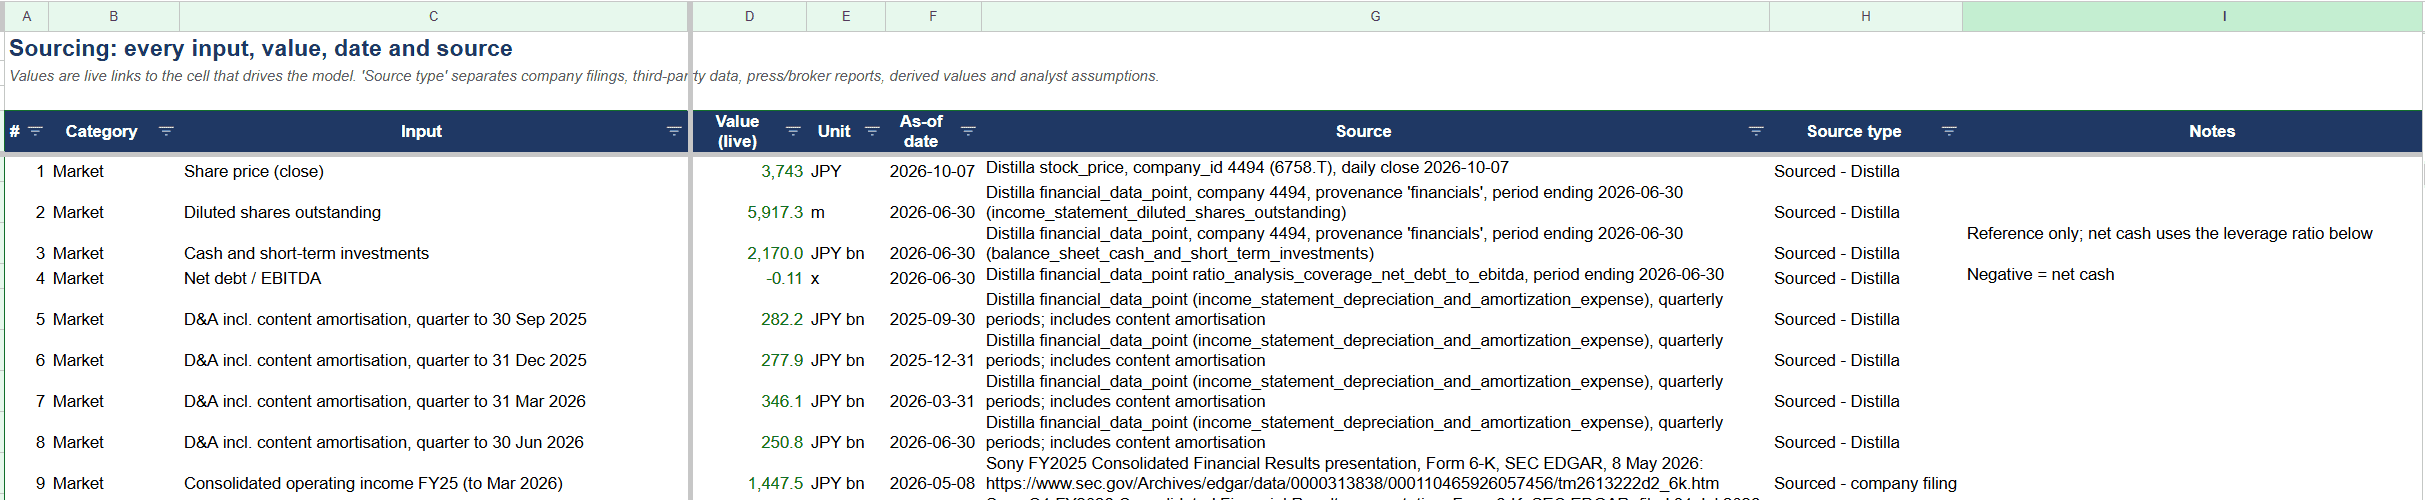
The sourcing tab of the exported workbook: every input with its value, as-of date, source and source type, so a reviewer can trace each number.
Asking for the model “in code” matters. The agent then does the arithmetic in a script rather than in its head, and you can rerun it with different assumptions.
Scenario levers specific to Sony
The cases should move the things that actually drive Sony, not a generic growth rate. The levers our run used, or that are worth adding:
• The yen. The bull case assumes ¥158 to the dollar and the bear case ¥145, against Sony’s own assumption of about ¥153 for the rest of the year.
• Segment margins. In the base case, margins move to about 14% in Games, 20% in Music, 9% in Pictures, 8.5% in ET&S and 21% in I&SS by FY30. The bull and bear cases shift each one up or down.
• The Kumamoto earthquake. Sony’s guidance excludes it, so the bear case adds an ¥80bn hit in FY26.
• Sensor cycle and JV capex. Sony’s ¥465bn share of the TSMC joint venture is modelled as outflows over FY27 to FY29.
• Games momentum and the console cycle. Games carries the largest operating income and the biggest one-off adjustment.
• The Tamron proposal and buyback pace. Both change the share count and the net cash bridge. Check how your model treats them, and ask the agent to show it.
The worked result: a reverse DCF with AI
First, Claude rebuilt the base year. Sony’s FY26 operating income guidance of ¥1,720bn becomes ¥1,670bn of underlying operating income after removing about ¥80bn of tariff refunds and adding back ¥30bn of joint venture costs. On the same basis (less ¥80bn of tariff refunds, plus ¥30bn of joint venture costs), the FY26 consensus of ¥1,777bn becomes about ¥1,727bn, roughly 3% above the model’s figure.

The base case reconciled to guidance, and the three cases at an 8% WACC and 2% terminal growth.
At an 8% WACC and 2% terminal growth, against Sony’s closing price of ¥3,743 on 7 October 2026:
Case | Value per share | vs ¥3,743 | Operating income FY35E | Operating income CAGR FY26 to FY35 |
Bear | ¥1,959 | -48% | ¥1,480bn | -0.8% |
Base | ¥3,209 | -14% | ¥2,328bn | 3.8% |
Bull | ¥4,247 | +13% | ¥3,043bn | 6.9% |
The terminal value accounts for 61% to 64% of enterprise value in all three cases, which is typical for a DCF and a reminder of how much rides on the long-run assumptions.
The more useful output is the reverse DCF, which shows what is priced in.
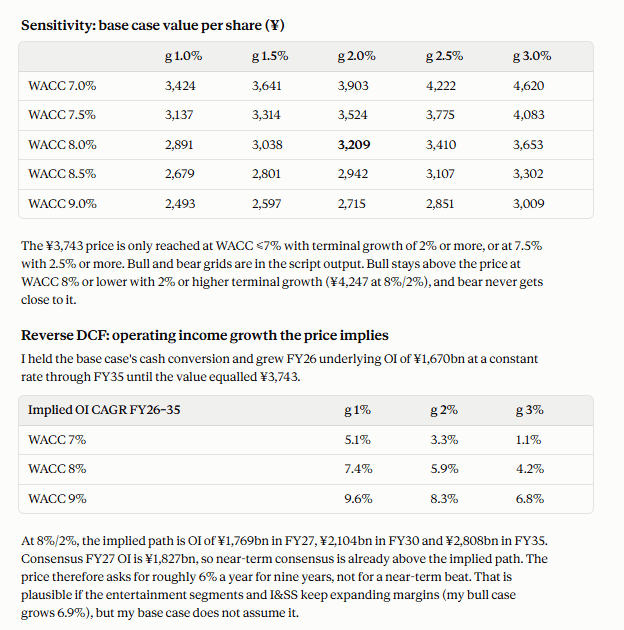
The sensitivity table for the base case, and the reverse DCF: the operating income growth the share price implies.
Holding the base case’s cash conversion, the current price implies operating income growth of about 5.9% a year from FY26 to FY35 at 8% and 2%. The base case assumes 3.8%. So the market is pricing in something closer to the bull case. Near-term consensus of ¥1,827bn for FY27 already sits above the implied path of about ¥1,769bn, which means the price does not need a single big beat, just steady margin expansion over many years.
For context, the average sell-side target price in Distilla’s data was ¥4,854 on 7 October 2026, above even this model’s bull case. That gap is a prompt for more work, not a conclusion. Brokers may be assuming stronger margins or a lower discount rate than this model; the next step would be to pull the summaries of sell-side views and find out.
How to make the model robust
Cite every assumption. Each input should carry a date and a source, as in the input map. The export’s sourcing tab makes that permanent.
Reconcile to guidance. Start from what management has guided and adjust explicitly for one-offs, so the base case is anchored to something observable.
Run sensitivities. In our run, the base case value ranged from ¥2,493 to ¥4,620 across WACC of 7% to 9% and terminal growth of 1% to 3%. Show that range alongside the point estimate.
Compare to the street. Set the result against consensus estimates and the sell-side target range, and find out where the differences come from.
Have the agent run the math in code. It makes the model reproducible and easy to change.
Check what the agent flags. Claude marked the Tamron price and one JV cost as unconfirmed. Those are the inputs to verify before you rely on the output.
Limits
This is an illustration of a workflow, not a valuation of Sony. Some inputs rest on assumptions the agent had to make: the model assumes the BRAVIA Inc. TV joint venture removes no profit, a simplification worth testing because the business moves out of Sony’s consolidated results and into a 49% equity-method stake from April 2027, and Sony’s guidance excludes the Kumamoto earthquake, so only the bear case includes it. Distilla’s data comes from filings, results materials, summaries of sell-side views and podcasts, and news; some inputs, such as a reported deal price, may come from secondary sources, and the agent should say so. Check the figures that matter against Sony’s own investor relations materials. For models that must tie out to the filing line by line, a specialist audit-grade KPI source such as Daloopa is an alternative at fund-level prices, and the company’s own filings remain the final check. A DCF is also very sensitive to its long-run assumptions: terminal value was 61% to 64% of enterprise value here, so treat the output as a range, not a number.
FAQ
Can Claude build a DCF model?
Yes, if it has real inputs and runs the calculations in code. Connected to Distilla, Claude can gather segment data, guidance, one-offs and consensus, then build and export the model.
What is a reverse DCF?
It works backwards from the share price to find the growth or margins the price implies. For Sony, the price on 7 October 2026 implied about 5.9% a year of operating income growth through FY35 at an 8% WACC and 2% terminal growth.
Does this work in Codex?
Codex can connect to remote MCP servers, according to OpenAI’s documentation. Distilla does not yet list Codex among its supported clients, so test the connection first.
Why build a segment model instead of a group model?
Because Sony’s segments have very different margins, growth and risks. A group-level model hides which businesses are driving the value.
Why not let the agent build the model from web search?
Web content is inconsistent: search ranks pages on criteria other than relevance, has no timestamps, and figures differ between sources, so numbers get mixed across periods and definitions, and the agent can pick different pages on different runs. Dated, sourced inputs from a data layer make the model easier to reproduce and check.
Is this a price target for Sony?
No. The figures illustrate how the workflow works. Different assumptions give very different values, as the sensitivity table shows.
Is this investment advice?
No. Distilla is a research tool, not investment advice.
About Distilla
Distilla is the fundamental research layer for AI agents: why stocks move, not just where. It brings institutional-grade research data to individual investors and small teams through an MCP server and HTTP API that gives Claude, ChatGPT and your own agents quantitative data, qualitative research and structured company knowledge in one queryable, read-only layer. The same data powers an enterprise product used by institutional investors.
• Quantitative: financial statements, analyst consensus, valuation history and company metrics, including AI-extracted segments and industry-specific KPIs.
• Qualitative: earnings-call and filing commentary, about 200K summaries of sell-side views and investor podcast episodes, and 7.3M+ qualitative knowledge cells (segments, guidance, KPIs and topic changes extracted from filings and calls).
• Company intelligence: company events (about 50,000 added weekly, 100+ event types), products, peers and sector relationships, and 438K+ explained price moves of 3% or more.
Company-level coverage is about 1,200 companies today, expanding across the US, Japan, Hong Kong, Korea and China A-shares; view and podcast summaries extend beyond that universe. Read-only MCP server at https://api.distilla.ai/mcp, with the same lookups over an HTTP API. Works with Claude, ChatGPT, Claude Code, Cursor, WorkBuddy and Doubao. Free plan, with paid plans from $9.90/month. Distilla is a research tool, not investment advice. Figures are as of 7 October 2026.